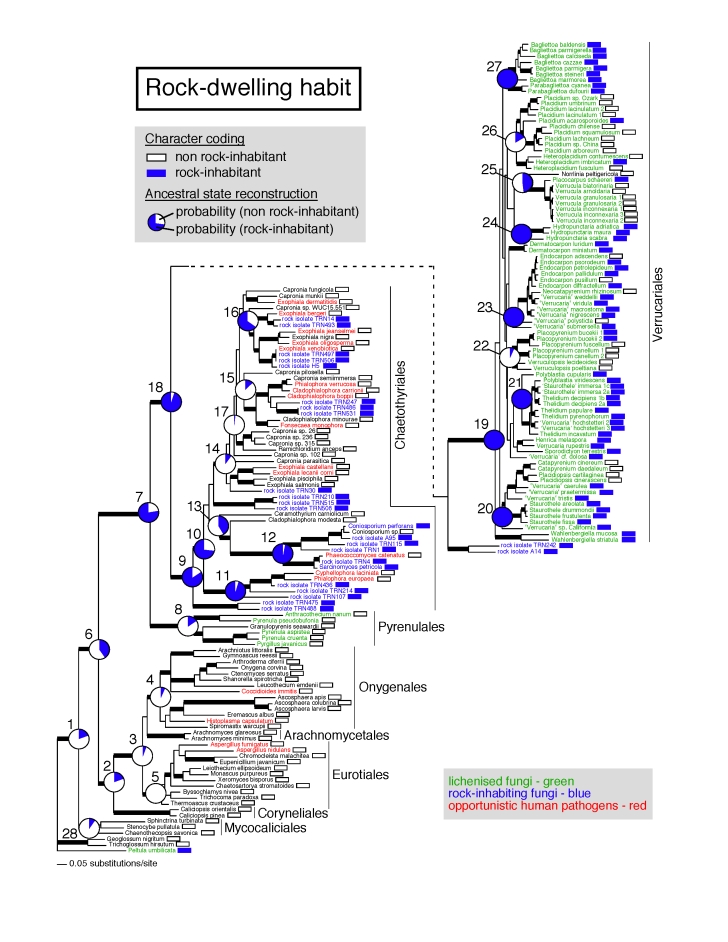
Fig. 2.
Four-locus phylogeny of the Eurotiomycetes obtained from a Bayesian MCMC analysis depicting ancestral state reconstruction of the rock-dwelling habit. Thick branches represent nodes supported by PP ≥ 95 % and ML bootstrap ≥ 70 % (see Table 2 for numerical values). Boxes after each name indicate the state for each extant taxon (white box = non rock substrate, blue box = rock substrate). Posterior probabilities for each of the two states are represented in pie charts at each reconstructed node (numbered from 1 to 28). Additional information for these 28 nodes is provided in Table 2.

