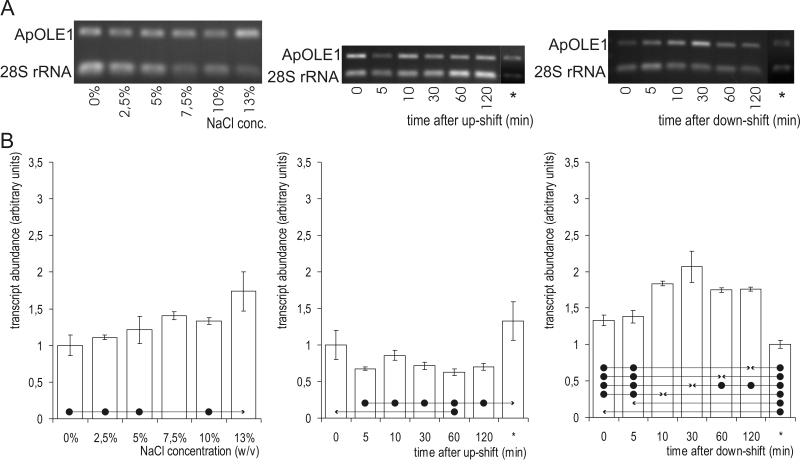
Fig. 5.
ApOLE1 mRNA abundance. A. Semi-quantitative transcriptional analysis by RT-PCR. Samples were prepared from cells grown at different salinities (first column) or subjected to a salinity shift from 0 % to 10 % NaCl (second column) and 10 % to 0 % NaCl (third column). mRNA abundances in cells completely adapted to the final salinity (10 % in the case of an up-shift, and 0 % in the case of a down-shift) are marked with an asterisk (*). Amplified fragments of ApOLE1 and 28S rRNA genes were run on 1 % agarose gel and stained with ethidium bromide. B. ApOLE1 gene expression as detected by RT-PCR. Data represent means ±SD of three independent experiments. Significant differences (Tukey's HSD) were seen between the value marked with an arrow-head and each of the samples marked with the dot.

