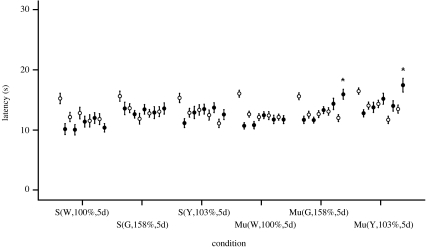
Figure 4.
Experiment 2 included 14 animals for each of the 3 sham (S) exposures and 28 for each of the 3 mu-metal box-shielded (Mu) exposures. On day 5 of the green (Mu(G,158%,5d)) and yellow (Mu(Y,103%,5d)) light exposures, significant increased latencies (mean±s.e.m.) were seen despite intensities of green and yellow lights that exceeded ambient housing intensities of the same wavelengths. Symbols and asterisk defined are the same as given in the caption of figure 3.

