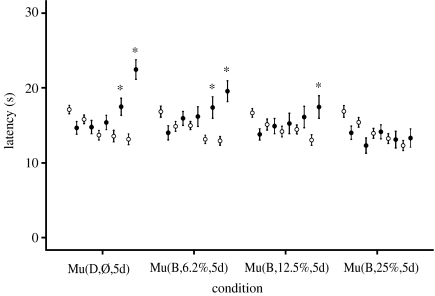
Figure 7.
Experiment 5 included 30 animals in each of the four groups. The induction of analgesia is clearly evident in the positive control (Mu(D,Ø,5d)). Blue light of an intensity of 25% of that in the animal facility (Mu(B,25%,5d)) abolished the induced analgesia, whereas 6% (Mu(B,6.2%, 5d)) and 12.5% (Mu(B,12.5%,5d)) did not. Values are reported as mean±s.e.m. Symbols and asterisk defined are the same as given in the caption of figure 3.

