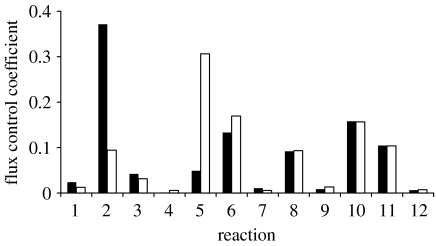
Figure 5.
Average flux control coefficients of each cluster identified by the principal component analysis. For each reaction, mean of the coefficient values weighted by the size of their respective cluster correspond to the values given in figure 3. Filled bars, cluster 1; open bars, cluster 2.

