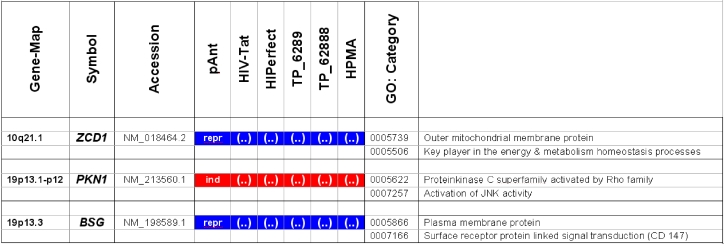
Table 4.
Description of the location and known function of the three mainly affected genes. The table lists the up- (induced, red) or down-regulated (repressed, blue) genes detected. The left column describes the chromosomal locations, the second column the gene symbols, the third the accession number. The following six columns describe the induction or repression by the different transporter molecules applied and indicated on top. The two columns on the right side depict the gene ontology category.

