
Fig. 3.
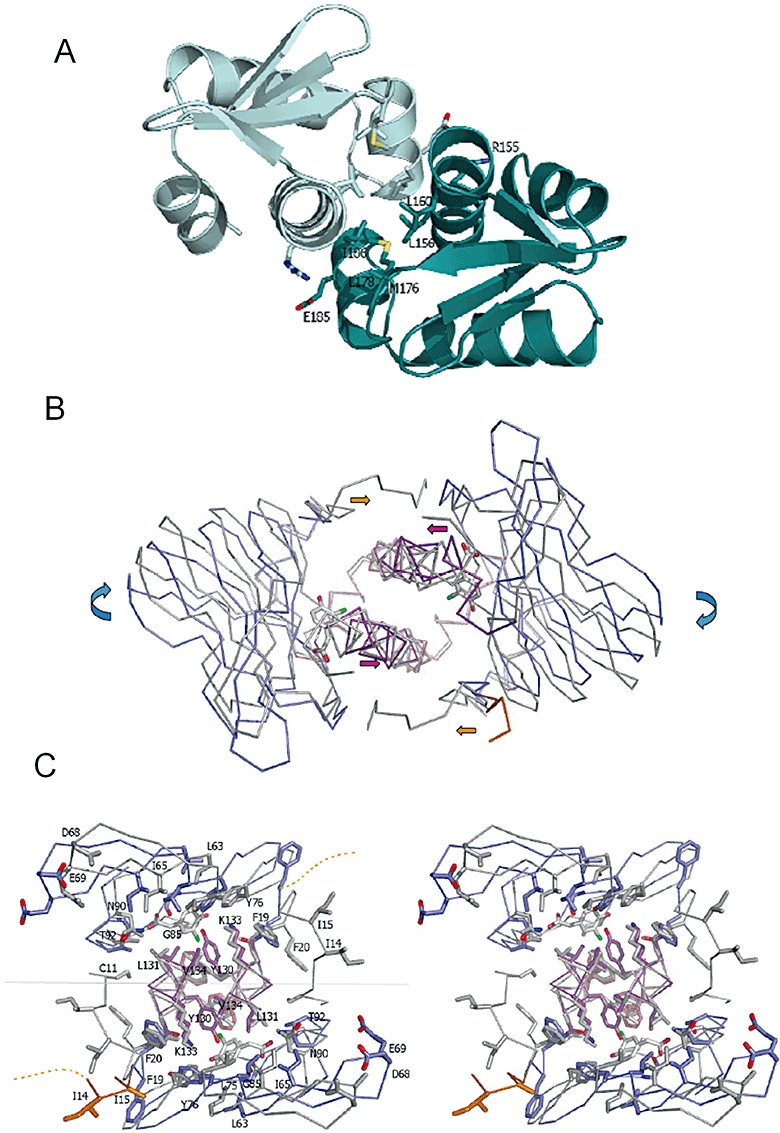
Structure of the ligand-free CprKC200S.
A. DNA domain interface. A stereo view of the DNA-binding domain interface with key residues represented in atom coloured sticks.
B. Overlay of the CprKC200S ligand-free sensor domains (ribbon model coloured as in Fig. 1) with the corresponding CprKC200S:OCPA structure (in grey ribbons). Coloured arrows indicate relative motion of individual structural elements upon ligand binding.
C. Stereoview of an overlay of the ligand binding sites and immediate environment for both CprKC200S and CprKC200S:OCPA structures. For clarity, labels in the left panel indicate the position of CprKC200S residues below the grey horizontal line and for CprKC200S:OCPA residues when above that line.