
Fig. 5.
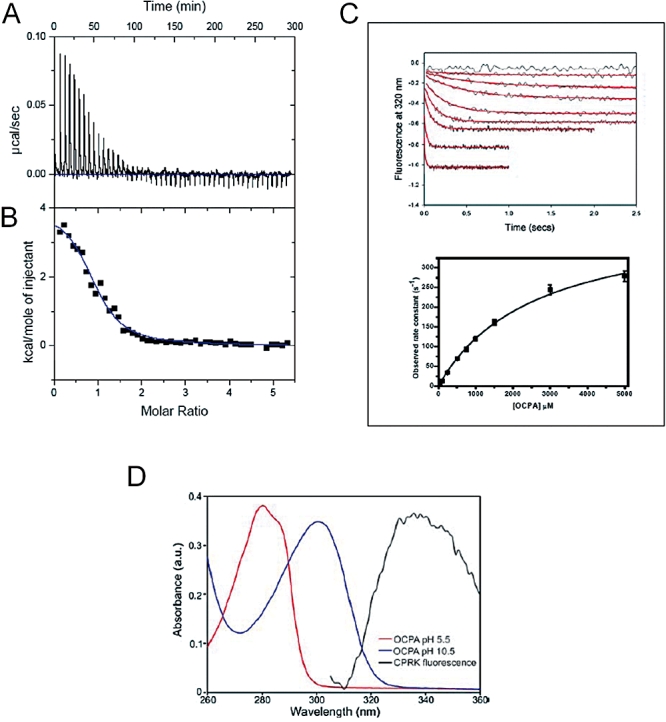
Solution data for OCPA binding by D. hafniense CprKC200S.
A. ITC analysis of CprKC200S OCPA interaction. The ITC experiment was carried out by titrating OCPA into the chamber containing CprK. This panel shows the raw heating power over time.
B. The fit of the integrated energy values.
C. Stopped-flow Trp fluorescence quenching. The top panel represents stopped-flow kinetic transients observed upon mixing various concentrations of OCPA with 1 μM CprK. An excitation wavelength of 295 nm was used and the fluorescence emission was measured using a 320 nm cut-off filter. Transients were recorded between 1 and 10 s at 0, 1, 5, 10, 25, 50, 100, 250 and 500 μM OCPA. The bottom panel depicts the OCPA concentration dependence of the observed rate.
D. OCPA absorbance. Absorbance spectra of 5 μM OCPA were recorded in 25 mM Tris, 25 mM ethanolamine, 50 mM MES, 50 mM NaCl at pH 5.5 and pH 10.5. A significant red-shift in the absorbance maximum of the OCPA occurs upon deprotonation. The fluorescence emission spectrum of 1 μM CprK using an excitation wavelength of 295 nm is overlayed for a direct comparison.