
Fig. 4.
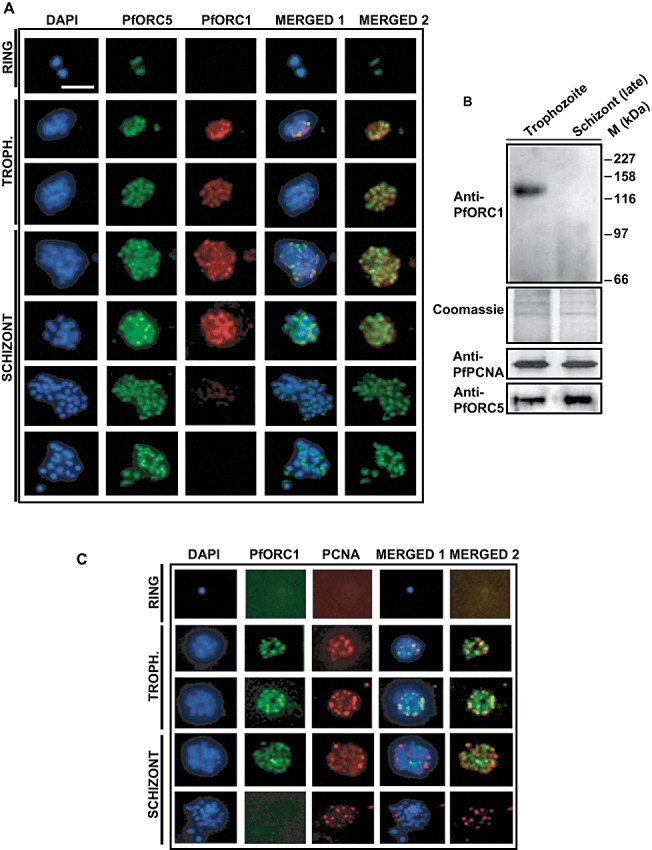
Colocalization pattern of PfORC5 and PfORC1 during different erythrocytic stages.
A. Immunofluorescence assay to show expression pattern of PfORC5 and PfORC1 during different development stages. Affinity-purified rabbit anti-PfORC5 and mouse anti-PfORC1 antibodies were used as primary antibodies followed by respective secondary antibodies. Merged 1 panel shows the merged images of nuclear DAPI, green PfORC5 and red PfORC1 signals whereas merged 2 panel shows the merged images of green PfORC5 and red PfORC1 signals. The bar is equivalent to 3 μm.
B. Western blot analysis to compare the expression of various replication initiation proteins during trophozoite and late schizont stages. Equivalent amount of parasite pellet obtained from the above two stages were boiled in SDS-PAGE loading buffer followed by Western blot analysis using either anti-PfORC1 or anti-PfPCNA or anti-PfORC5 antibodies. Molecular mass markers are shown on the right. The membrane following Western blot was coomassie-stained to show the loading control.
C. Colocalization pattern of PfORC1 and PfPCNA during parasite development. Immunofluorescence assay was performed as described earlier using rabbit anti-PfORC1 and mouse anti-PfPCNA antibodies. The bar as shown in the inset is equivalent to 3 μm.