
Fig. 2.
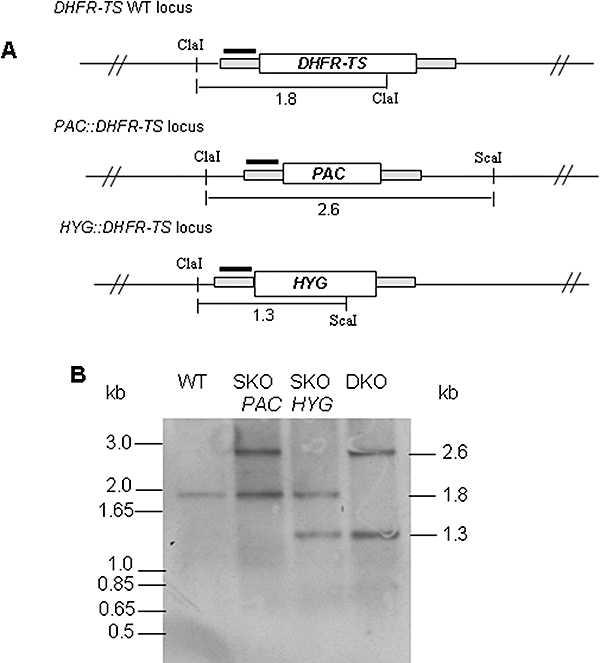
Genotypic analysis of WT, SKO and DKO cells.
A. Structure of the DHFR–TS locus and predicted replacements. The black bars represent the 5′-UTR region upstream of the open reading frames of DHFR–TS, PAC and HYG used as a probe in Southern blot analysis. Only relevant restriction enzyme sites with expected fragment sizes are shown.
B. Southern analysis of DNA digested with ClaI and ScaI from WT, SKO (containing PAC and HYG respectively) and DKO cells. DNA size markers are on the left-hand side of blots and the estimated size of detected fragments on the right.