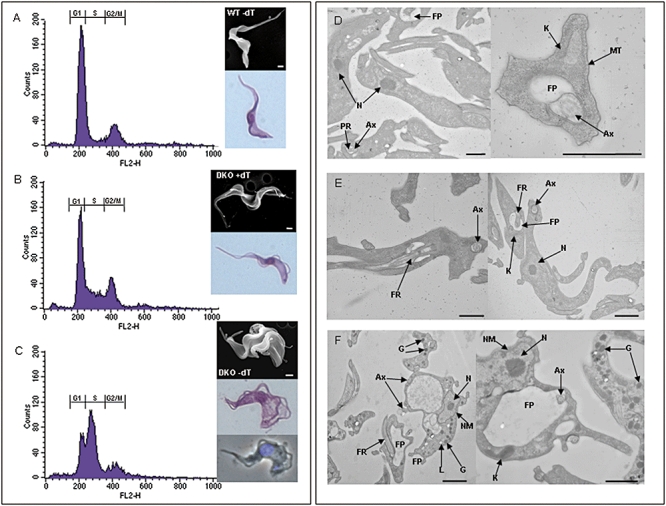
Fig. 5.

Phenotypic analysis WT and DKO cells grown in the presence or absence of thymidine. Cells were grown in either the absence or presence of thymidine (dT) for 24 h and prepared for FACS, SEM, Giemsa, DAPI and TEM analysis. The histograms from the FACS analysis are presented in (A) WT minus thymidine, (B) DKO plus thymidine, (C) DKO minus thymidine with SEM, Giemsa and DAPI images of the respective cells in the right-hand panels. TEM showing the morphology of the WT (D), DKO plus thymidine (E) and DKO minus thymidine (F) are depicted. Bars represent 1 μm. N, nucleus; NM, nuclear membrane; FR, flagella rod; FP, flagella pocket; Ax, axonemes; G, glycosome; L, lysosome; PR, paraxial rod; MT, microtubules.
