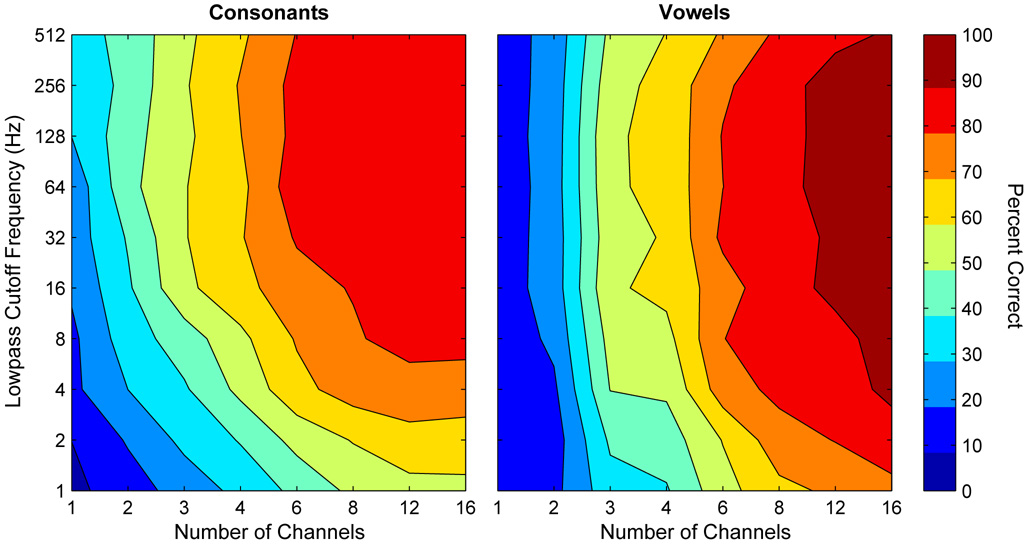
Fig. 1.
Mean phoneme recognition scores (percent correct) as a function of the number of channels and lowpass cutoff frequency. The left and right panels represent data for consonant and vowel recognition, respectively. In each contour plot, the area that is filled with a particular color represents the phoneme recognition score for a given number of channels (abscissa) and lowpass cutoff frequency (ordinate). The percent correct represented by the color is indicated by the bar on the right. Adapted from Xu et al. (2002) with permission from the Acoustical Society of America.

