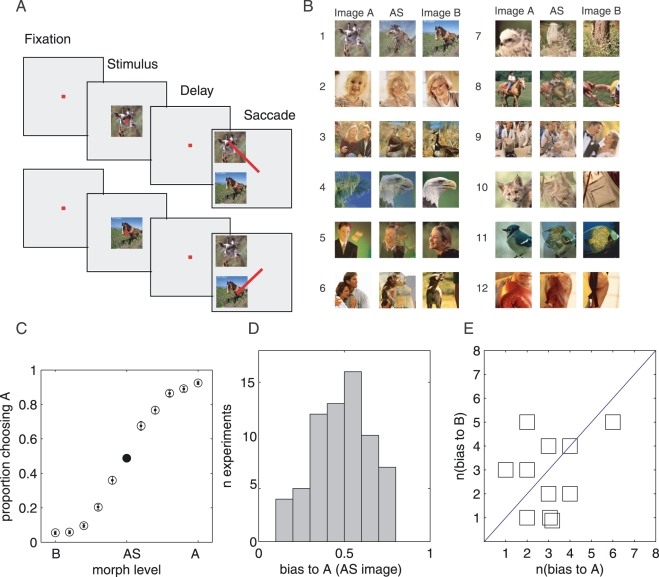
Fig. 1.
Task and behavioral performance. (A) 2AFC-DMS task with two possible sample stimuli appearing on different trials. Samples could be one of the pair of photographic images (which also served as the choice array) or any of 11 possible morphed stimuli. One example image pair is shown, but the images used could be any of 11 other pairs. (B) Images used as samples: AS created by morphing or interpolating between the two original photographs, image A and image B, averaged across sessions (n = 67). (C) Proportion of selections of Stimulus A as a function of the similarity to image A. (D) Distribution of behavioral bias towards A across sessions (n = 67). (E) Number of sessions in which individual stimuli resulted in a bias towards A vs. number of sessions in which individual stimuli resulted in a bias towards B (n = 11 images; image pair no. 2 was excluded because no selective cells were found for that image pair).

