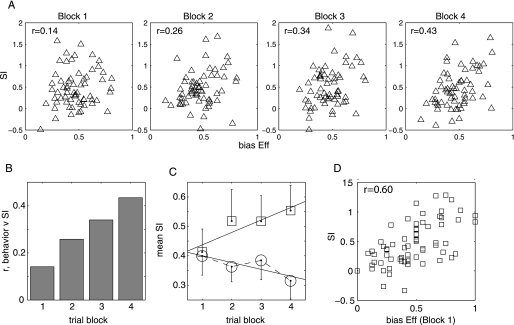
Fig. 5.
(A) SI vs. the bias in classifying the AS as the Eff image in four successive 1/4 block of trials in the session. (B) R-value of correlation between SI and classification bias towards A as a function of block in the session. (C) Mean SI in the same Eff bias (squares) and Ineff bias (circles) sessions as a function of block in the session. (D) SI vs. bias in classification to Eff in block 1; r = 0.6013, P < 0.00001).

