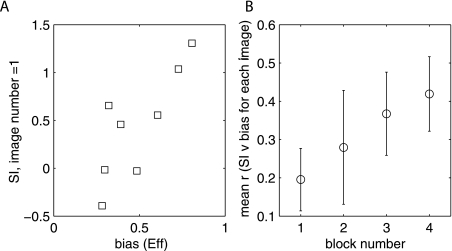
Fig. 6.
(A) SI for individual neurons recorded with image no. 1 (horse/giraffe) as a function average bias towards the Eff image in the session (r = 0.81, P = 0.02). (B) Mean correlation (r) between SI and stimulus bias in a session, averaged across all stimuli for which there were at least three available sessions, in blocks 1–4 of the session (n = 10 images, p of correlation different from zero, in block 4, P = 0.0019). The mean correlation increased over the course of the session: r = 0.99, P = 0.0059.

