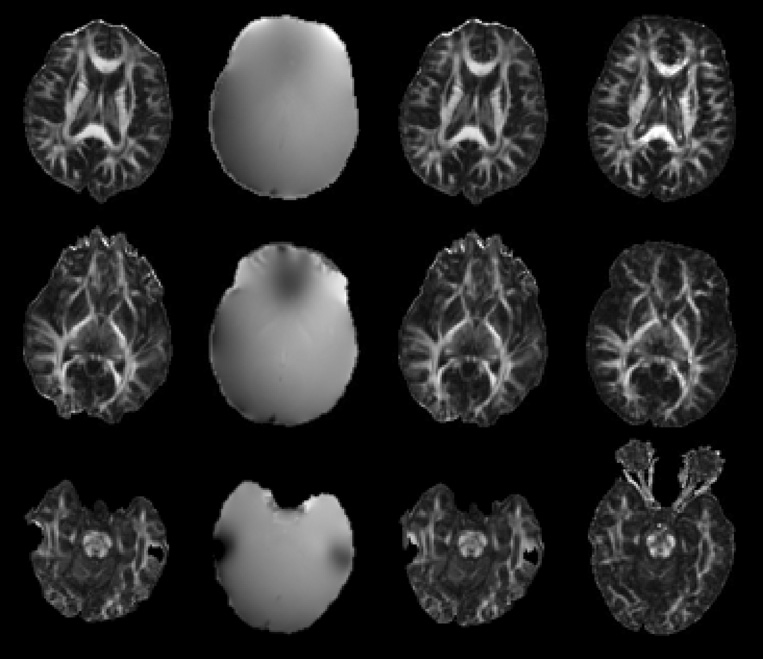
Figure 2.
Each row in this figure corresponds to a different slice of a normal volunteer. The first column contains FA maps produced from SE-EPI-DTI12 data (after correction of eddy-current distortions). The second column contains the corresponding unwrapped phase-maps. The third column contains FA maps produced from SE-EPI-DTI12 data that have been corrected for susceptibility-related distortions. The last column contains FA maps produced from Turboprop-DTI data. Distortions, signal loss and signal hyperintensities are visible in the SE-EPI-DTI12 images near tissue-bone and tissue-air interfaces, even after correction using the phase maps. In regions distant to significant magnetic field inhomogeneities, the distortions in SE-EPI-DTI12 images are not as pronounced. Turboprop-DTI images are free of eddy-current and susceptibility related artifacts.

