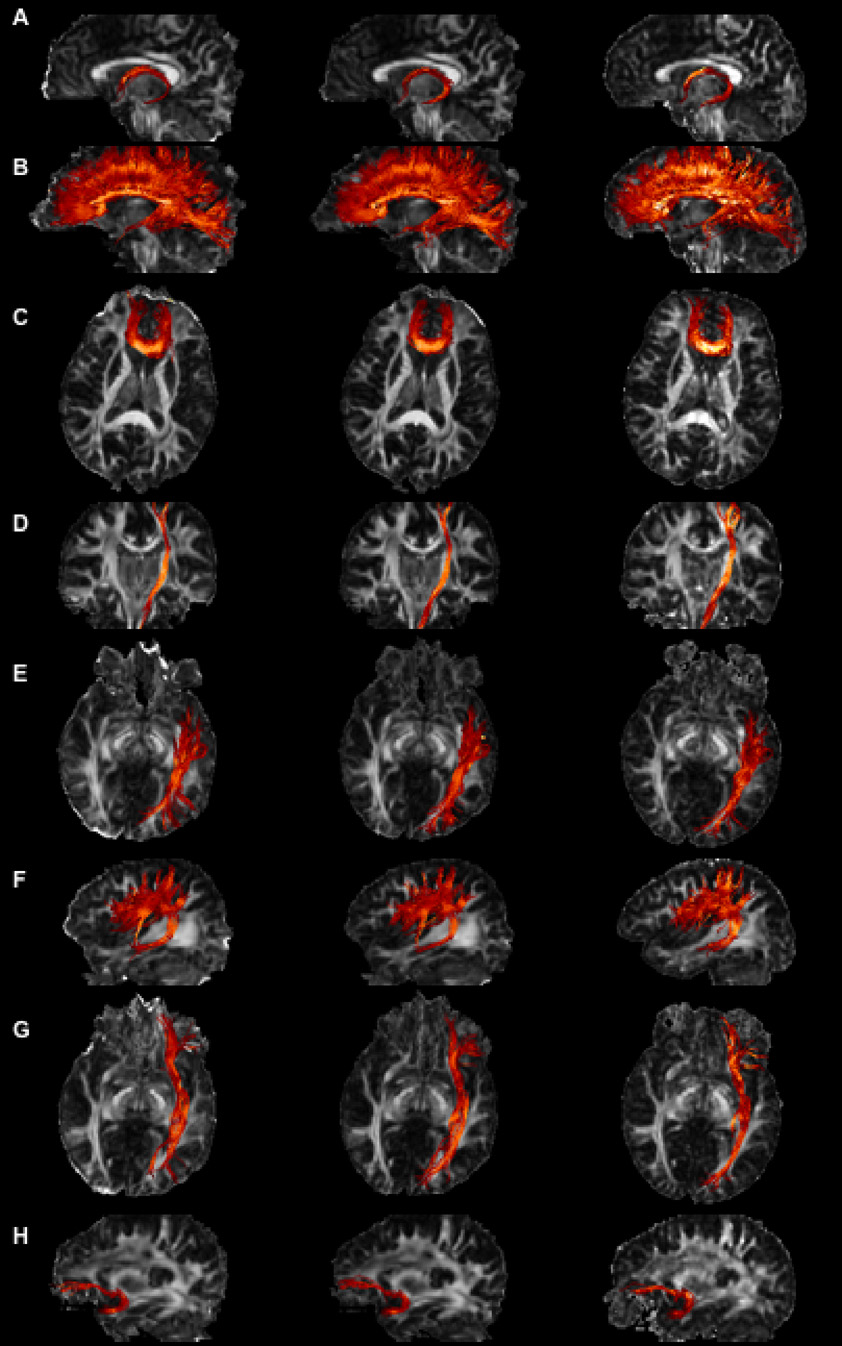
Figure 4.
Images of the fornix (A), CC (B), FM (C), CST (D), ILF (E), SLF (F), IOF (G), UF (H), produced using SE-EPI-DTI12 (first column), SE-EPI-DTI138 (second column), and Turboprop-DTI (third column) datasets. FA maps from the corresponding datasets are displayed in the background. The projection of all fibers assigned to a bundle is shown, independent of if the fibers are in front or behind the 2D plane of the background FA map. Bright colors correspond to fibers with high FA values and dark colors to fibers with low FA values. All data were acquired in the same scan session and on the same normal subject.

