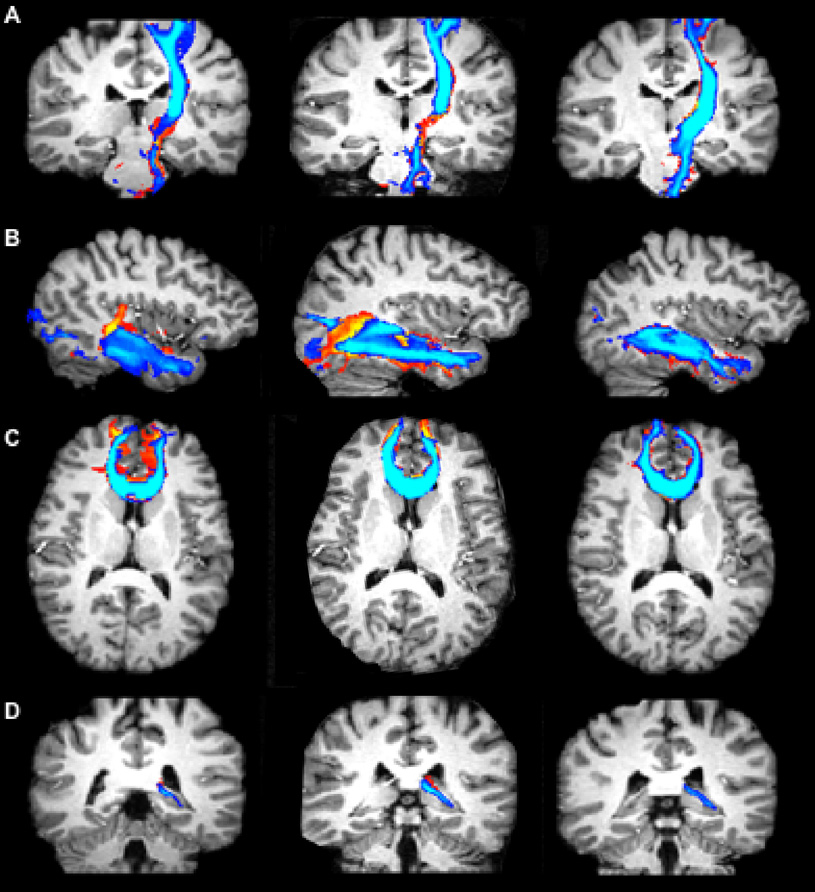
Figure 6.
Images of the cross-section of all copies of the CST (A), ILF (B), FM (C), fornix (D), produced with wild bootstrap for two separate scan sessions, with various slices of a healthy human brain. The fiber tracts were produced from data acquired with SE-EPI-DTI12 (first column), SE-EPI-DTI138 (second column), and Turboprop-DTI (third column). MPRAGE images from the corresponding slices are displayed in the background. Blue fibers were generated from DTI data acquired in a different position of the head than red/yellow fibers. The overlap of fibers generated from data acquired in different scan sessions is higher for Turboprop-DTI than SE-EPI-DTI12, and SE-EPI-DTI138.

