
Fig. 6.
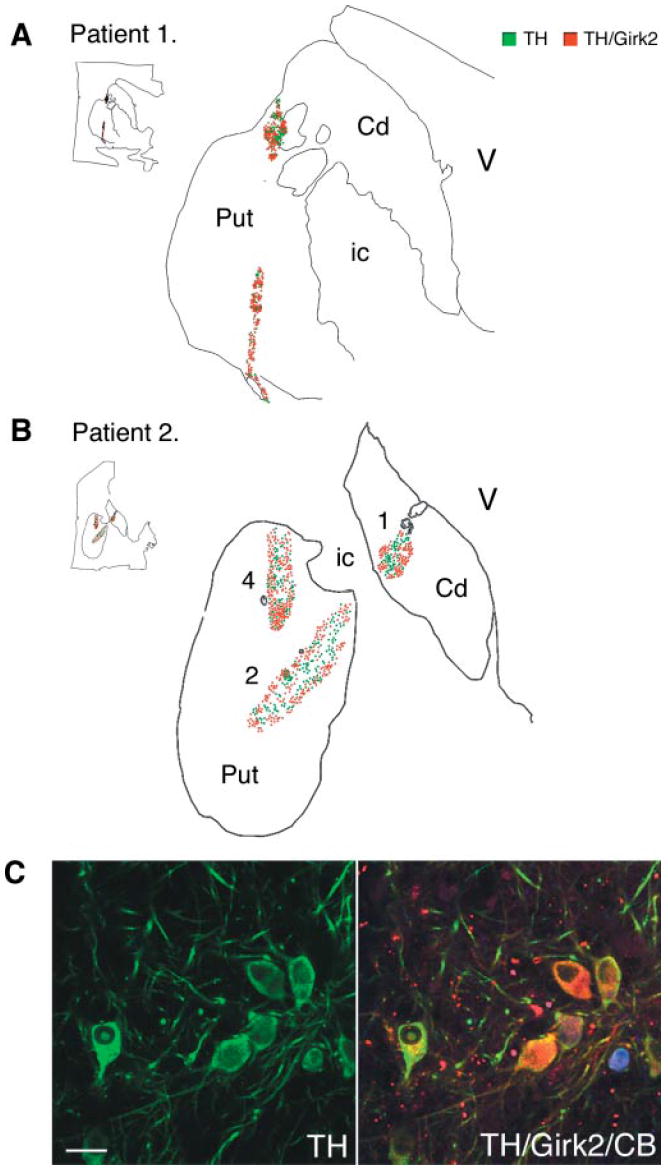
Maps of the dopamine subpopulations, TH/Girk2-positive neurons (red) and TH/Girk2-negative neurons (green) in the putaminal grafts. The maps were generated from representative transverse sections double-immunolabelled for TH and Girk2 using Neurolucida software. Each dot represents one cell. (A, patient 1, and B, patient 2) TH/Girk2-positive neurons were preferentially located in the outer layer of the grafts in the putaminal grafts. (C) Confocal images of triple immunofluorescence studies of TH (green), Girk2 (red) and calbindin (blue) within a putaminal graft (see Table 2 for quantification). Numbers identified the tracks as described in Fig. 3. TH = tyrosine hydroxylase; CB = calbindin; Cd = caudate; Put = putamen; V = lateral ventricle; ic = internal capsule. Scale bar in C, 50 μm.