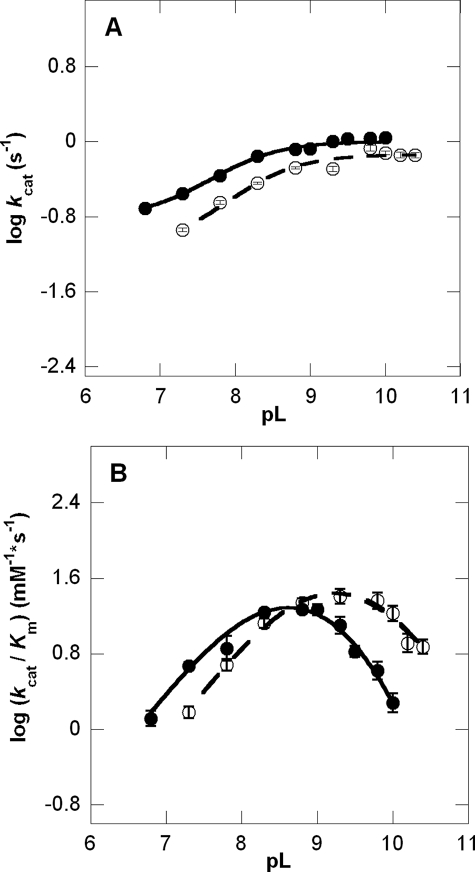
FIGURE 2.
pL versus log rate profiles at 25 °C of kcat (A) and kcat/Km (B) in 100% H2O (•) and >95% D2O (○). The pH-rate profiles gave R2 values of 0.99 and 0.99 for kcat and kcat/Km, respectively, and the fit to the pD-rate profiles had R2 values of 0.98 and 0.99 for kcat and kcat/Km, respectively. Error bars are shown for all data points and do not exceed the size of the data points when not visible.

