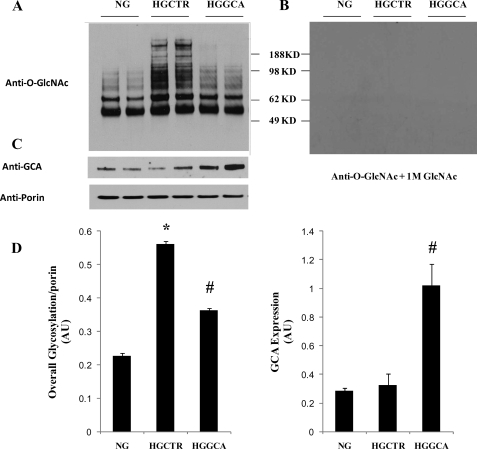
FIGURE 2.
Overall mitochondrial O-GlcNAcylation level increased with high glucose and was reduced with GCA overexpression. NCM were treated with normal glucose (NG), control adenovirus Adv-CTR (HGCTR) or Adv-GCA (HGGCA) for 48 h, then mitochondrial proteins were extracted separated on a 4-12% Bis-Tris gel. 40 μg of mitochondrial protein for each lane were loaded. The membrane was probed with anti-O-GlcNAc antibody (A), then stripped and reblotted with anti-O-GlcNAc antibody plus 1 m GlcNAc (B). Same blots were tested with anti-O-GlcNAcase and anti-porin antibody to ensure equal loading (C). Graphs showing summarized data of relative overall mitochondrial protein O-GlcNAcylation and GCA expression. Signal was normalized with porin (D). Results are presented as mean ± S.E., *, p < 0.05 versus NG; #, p < 0.05 versus HG, n = 4.

