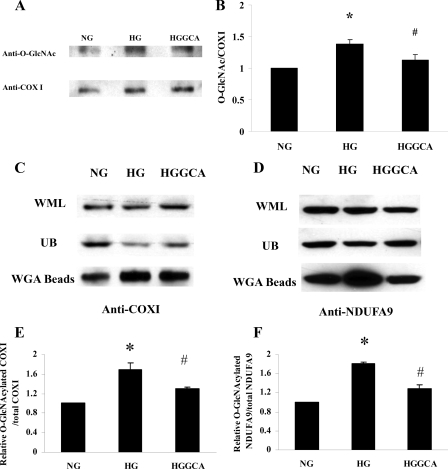
FIGURE 7.
O-GlcNAcylation of COX I and NDUFA9 are increased with high glucose and decreased with expression of O-GlcNAcase. NCM were treated with normal glucose (NG), high glucose (HG), or Adv-GCA (HGGCA) for 48 h. After treatment, COX I was isolated by immunoprecipitation with anti-COX I antibody followed by Western blot analysis. The same membrane was first blotted with anti-O-GlcNAc antibody, and then stripped and reblotted with anti-COX I antibody. A, O-GlcNAcylated COX I (upper bands) and total COXI(bottom). B, relative COX I O-GlcNAcylation level. Values are mean ± S.D. obtained from three independent experiments. *, p < 0.001 for NG versus HG; #, p < 0.01 for HGGCA versus HG. Whole mitochondrial protein lysate (WML) were incubated with WGA beads to pull-down O-GlcNAcylated proteins. After the incubation, the beads were spun down, and the supernatants were proteins without O-GlcNAc modification (unbound, UB), the proteins on beads were O-GlcNAcylated proteins (WGA). Western blots with anti-COX I (C) and anti-NDUFA9 (D) were used to analyze the proteins in these three parts. Relative ratios of O-GlcNAcylated COX I to total COX I (E) or of O-GlcNAcylated NDUFA9 to total NDUFA9 (F) were compared. *, p < 0.05 for NG versus HG; #, p < 0.05 for HGGCA versus HG (E and F). Values are mean ± S.D. obtained from three independent experiments.

