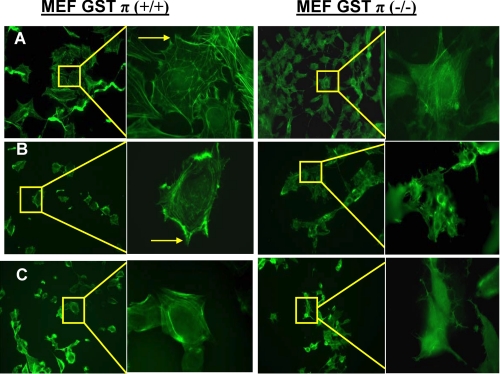
FIGURE 3.
S-Glutathionylation of actin is elevated in MEF-GST+/+ cells. MEF-GST+/+ and MEF-GST-/- cells were seeded on glass coverslips and treated with: A, vehicle; B, 300 μm GSSG; C, 15 μm PABA/NO for 1 h and stained with phalloidin to visualize actin polymerization/stress fiber formation. Arrow highlights focal contacts.

