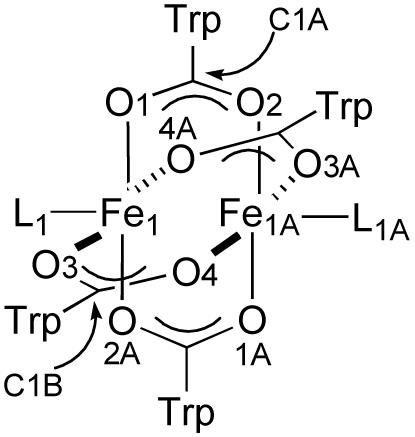
Table 2.
Comparison of Fe-Fe and Fe-L Distances (Å) and the Average Fe-O-C Angles (deg) in Complexes of the Type [Fe2(μ-O2CTrp)4(L)2]
 | ||||
|---|---|---|---|---|
| Ligand L | Fe-Fe | Fe-O-Cavg | Fe-L | Fe-Oavg |
| THF (1a) | 2.7307(8) | 125.0 | 2.076(3)a | 2.065 |
| 4-CNPy (11) | 2.772(2) | 125.5 | 2.086(3) | 2.054 |
| 4-PPy (12) | 2.822(2) | 126.3 | 2.084(4) | 2.077 |
| Py (2) | 2.8461(7) | 126.5 | 2.119(2) | 2.077 |
| 4-AcPy (10) | 2.8694(15) | 126.6 | 2.127(4) | 2.068 |
| 1-MeIm (3) | 2.8603(8) | 126.8 | 2.080(3) | 2.077 |
| 2-MeIm(4) | 2.9036(9) | 126.8 | 2.085(3) | 2.074 |
| 1-Pr-2-i-PrIm(8) | 2.906(1) | 126.9 | 2.088(2) | 2.087 |
| 2-i-PrIm (5) | 2.912(1) | 127.2 | 2.086(3) | 2.080 |
| 1-Et-2-i-PrIm (7) | 2.921(1) | 127.1 | 2.094(2) | 2.077 |
| 1-Pr-2-PhIm(9) | 2.964(1) | 128.3 | 2.110(4) | 2.079 |
| 2-PhIm(6) | 3.007(2) | 128.3 | 2.132(3) | 2.090 |
Average value.
