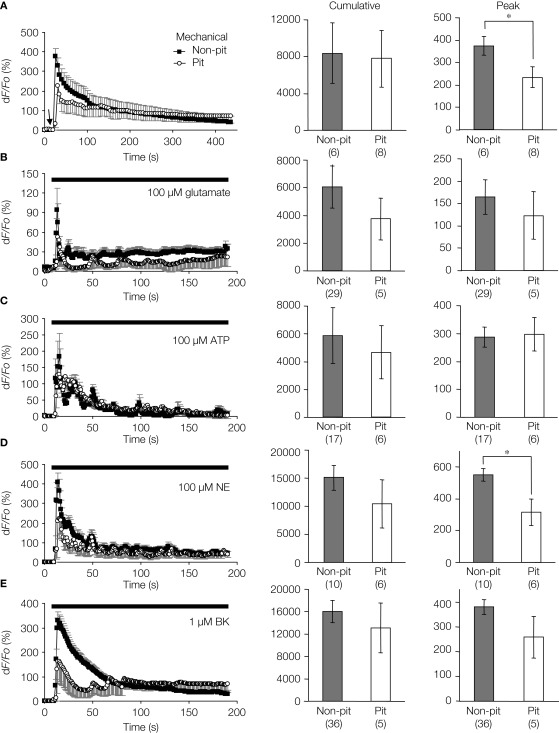
Figure 6.
Intracellular Ca2+ dynamics of astrocytes on micropatterned coverslips. (A–E) Comparison between the intracellular Ca2+ dynamics of solitary astrocytes in micropits and single astrocytes grown within grouped astrocytes in non-micropit regions after mechanical or agonist stimulation. The graphs on the left side represent fluo-3 fluorescence changes expressed as dF/Fo (%), with the points and error bars representing the mean and SEM (shown only in one direction for clarity). The arrow in panel (A) denotes the time that mechanical stimulation was applied to the cell. Horizontal bars in graphs (B–E) indicate the application of agonists: ATP, adenosine 5'-triphosphate; NE, norepinephrine; BK, bradykinin. Two sets of bar graphs on the right show quantification of cumulative and peak intracellular Ca2+ responses in astrocytes grown in micropit and non-pit regions of coverslips. The numbers of cells tested are shown in parentheses. The peak Ca2+ responses in non-micropit cells were significantly higher (Student's t-test; *p < 0.05) than in solitary micropit cells, upon mechanical (A) or NE stimulation (C).

