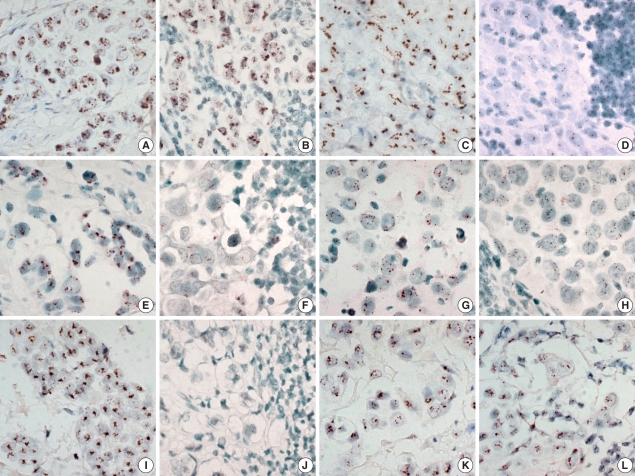
Fig. 2.
Comparison of gene amplification patterns of Her-2, EGFR and cyclin D1 in primary tumor and the corresponding metastatic lymph node (LN) (×400). High-level amplification/high-level amplification of Her-2 in primary tumor (A) and LN (B); high-level amplification/no amplification of Her-2 in primary tumor (C) and LN (D); high-level amplification/no amplification of EGFR in primary tumor (E) and LN (F); low-level amplification/low-level amplification of EGFR in primary tumor (G) and LN (H); high-level amplification/no amplification of cyclin D1 in primary tumor (I) and LN (J); high-level amplification/high-level amplification of cyclin D1 in primary tumor (K) and LN (L).

