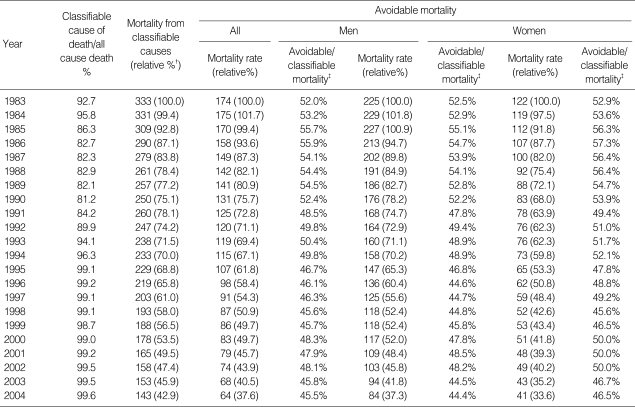
Table 2.
Time trend of age- and sex-adjusted all-cause and avoidable mortality rates* (relative percent†) among Korean persons aged between 1 and 64 yr, from 1983 to 2004
*, Age- and sex-standardized rates per 100,000 persons, calculated using the entire Korean population in 1990 as a reference group; †, percentage of age- and sex-adjusted mortality rate in each year compared to that in 1983; ‡, proportion of avoidable mortality of all classifiable mortality.

