
Figure 2A and 2B.
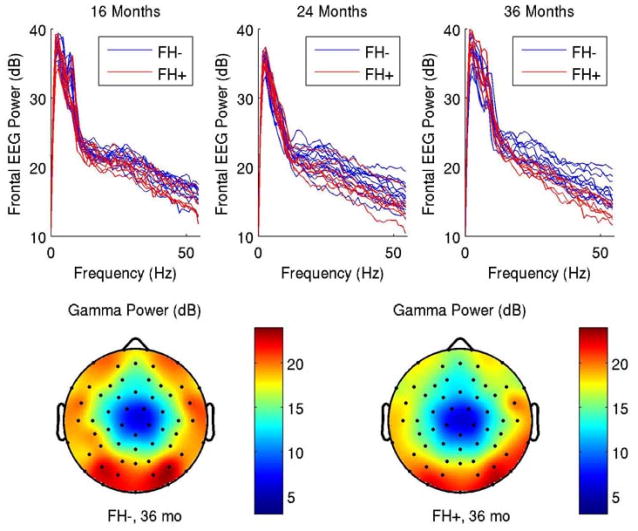
(A) Frontal EEG power spectra (averaged across the frontal and prefrontal electrodes indicated in Fig. 1) for control children and children with a family history of language impairment. At 16 months, the two populations largely overlap; by 36 months a clear distinction is seen with the family history group showing reduced power at 31Hz and above. (B) Scalp distribution of mean gamma power for each group at 36 months. The difference between the two is primarily seen in the frontal lateral region.