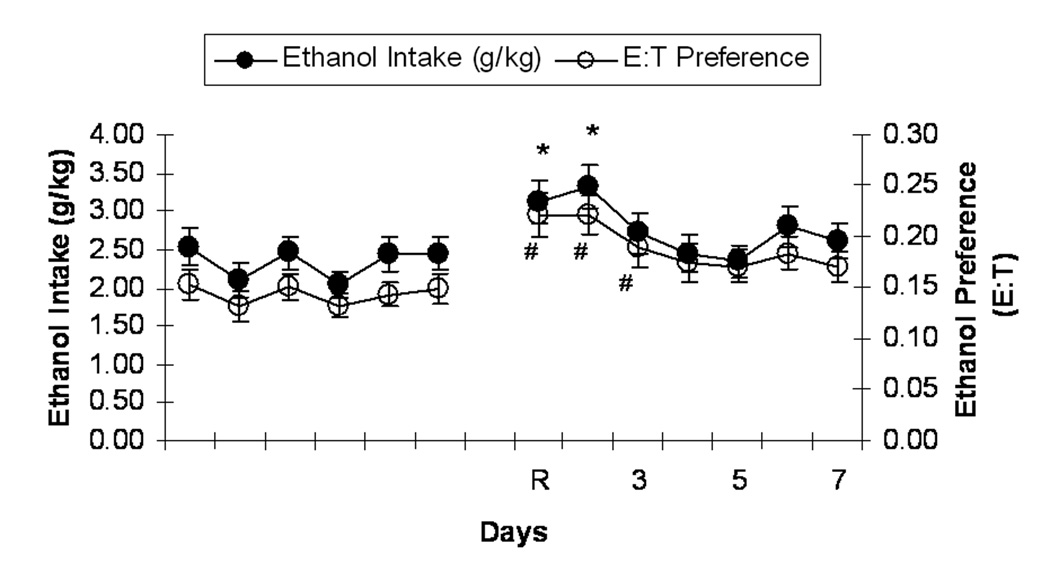
Figure 3.
Mean (± SEM) intake of 15% (v/v) ethanol (g ethanol/kg body weight; closed circles) and mean (± SEM) ethanol preference (ethanol consumed in ml/total fluid consumed in ml; open circles) by CHOICE ABST Wistar rats during the final 6 days of the initial 6-week baseline drinking period and during the 7-day reinstatement period. “R” denotes ethanol reinstatement day, and subsequent numbers indicate subsequent days of that drinking period. *p<0.001 significant difference from baseline ethanol intake (g/kg). # p<0.01 significant difference from baseline ethanol preference (E:T).

