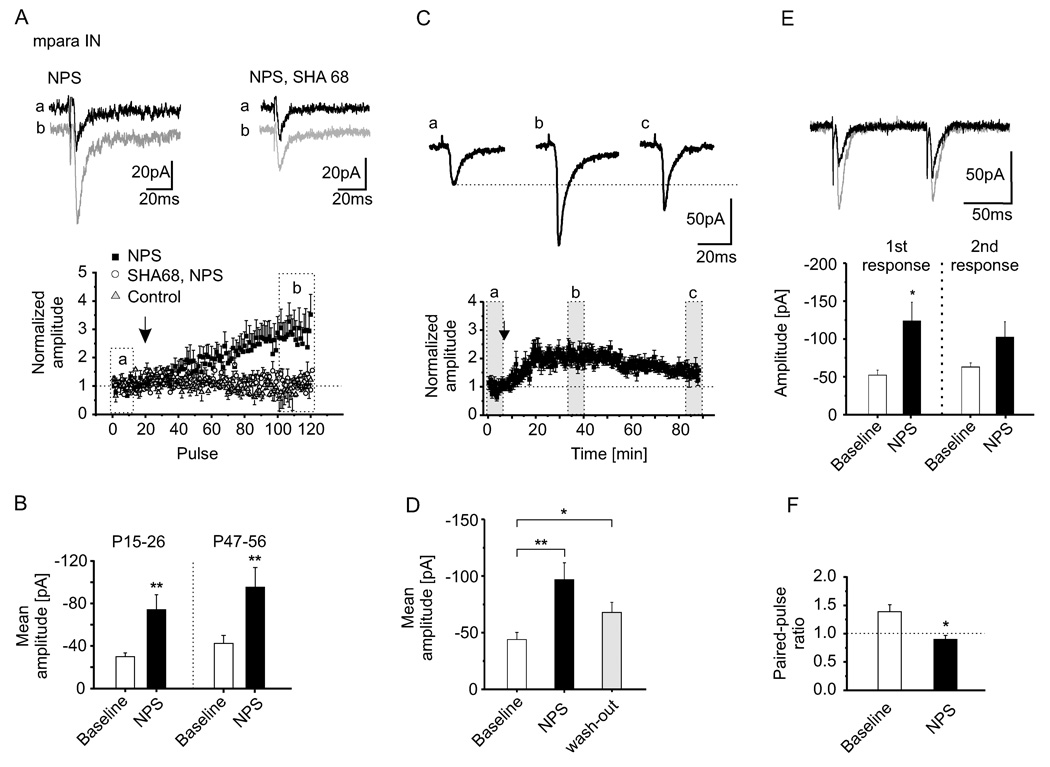
Figure 3. Target specific effect of NPS on evoked EPSCs.
(A) Representative current traces of glutamate receptor-mediated EPSCs in mpara IN (in P15–26 animals, n = 13) show an increase in EPSC amplitude in the presence of NPS at 10 µM (b, grey) compared to baseline stimulation (a, black), which is blocked by the NPS receptor antagonist SHA 68 (100 µM). Example traces refer to the time-points (a, b) depicted in the normalized amplitude-plot. At times of near-maximal NPS action, the mean EPSC amplitudes are significantly increased compared to pre-application baseline (B; p < 0.01), whereas amplitudes remain unchanged with no added NPS or in the presence of both NPS and receptor antagonist (see text for further details). (C) Representative current traces of glutamate receptor-mediated EPSCs in mpara IN (in P47–56 animals, n = 12) and normalized amplitudes during baseline stimulation (a), maximal NPS effect (b) and ~70 minutes after NPS application (c, wash-out) show a time-dependent decline of the NPS induced effects on evoked EPSCs. (D) Changes of the mean amplitudes compared to baseline amplitudes during full NPS effect (NPS vs. baseline p < 0.01) and after ~70 minutes of wash-out (wash-out vs. baseline p < 0.05). Comparison of the relative increase of EPSC-amplitudes at timepoints b and c revealed a significant reduction after wash-out (F; p < 0.05). (E) Effects of NPS on paired-pulse facilitation of EPSCs evoked upon intra LA stimulation in mpara IN. Representative current traces of paired-pulse experiments with a paired-pulse interval of 100 ms before (black) and during presence of 10 µM NPS (grey). During NPS, only the first response increased significantly (p < 0.05), and the paired pulse ratio was significantly reduced (p < 0.05; F). Data are mean ± SEM.

