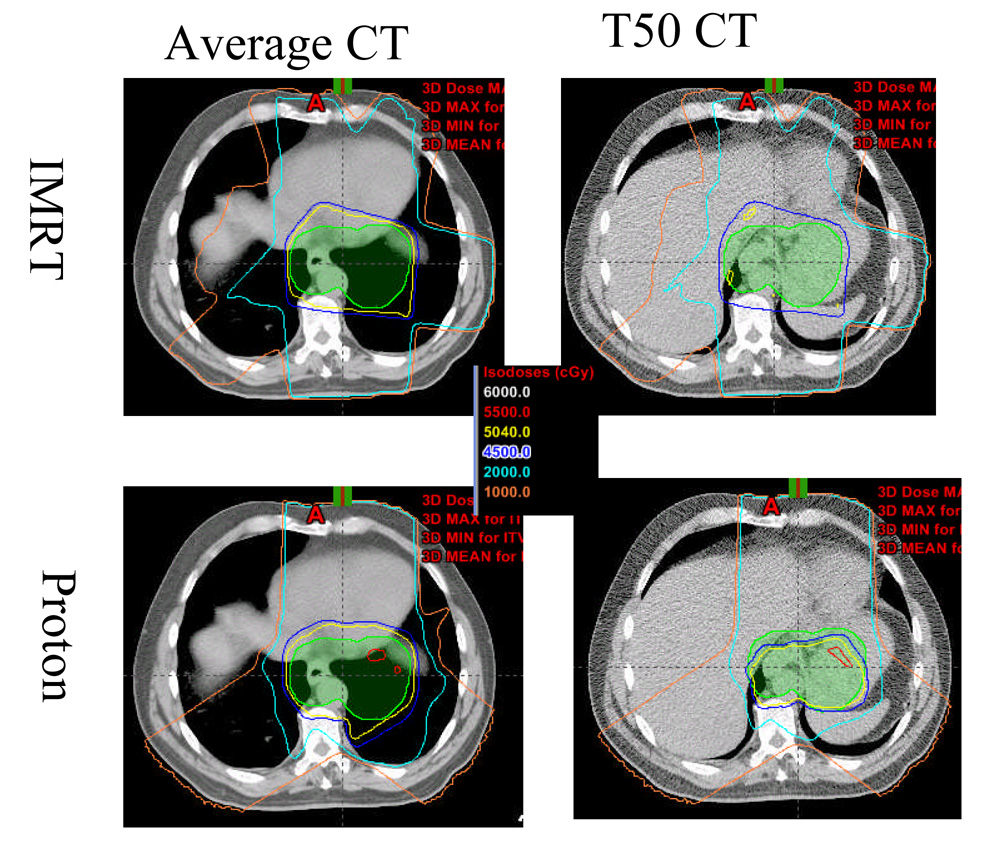
Fig. 5.
The effects of diaphragmatic motion on the dose distribution for patient 14 in the intensity-modulated radiation therapy (IMRT) plan (upper panels) and the three-beam proton plan (bottom panels). The panels at left show the dose distribution on the averaged CT; the panels at right show the dose distribution on the T50 phase of the 4D CT.

