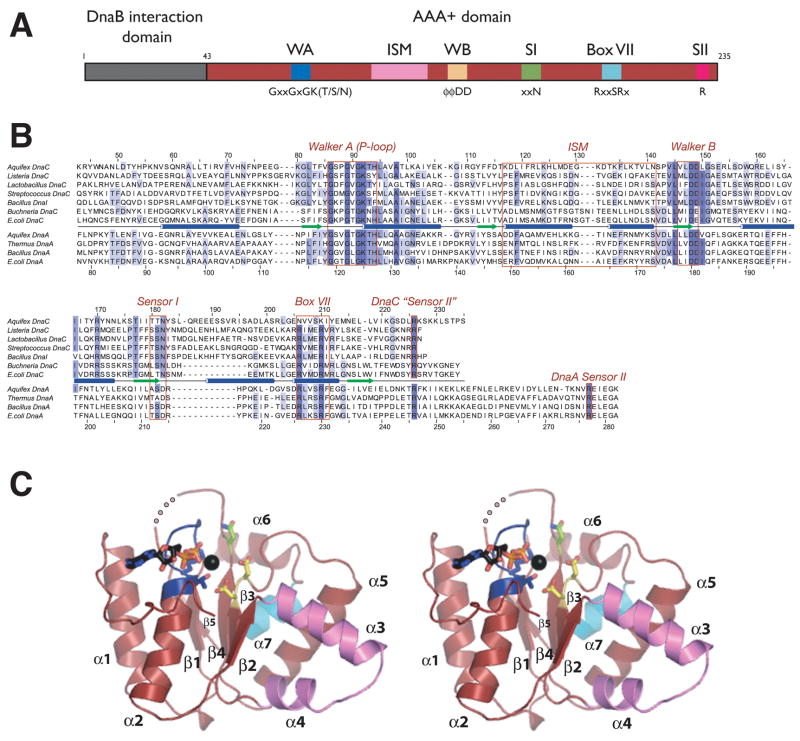
Figure 1. Structure of DnaCAAA+.
(A) Domain representation of DnaC. The N-terminal helicase binding region is colored gray and the central AAA+ domain is shown in red. Numbers refer to amino acid positions. AAA+ motifs are highlighted. WA – Walker-A, WB – Walker-B, SI – sensorI, SII – sensor-II, ISM – Initiator Specific Motif.
(B) Sequence alignment of selected DnaC and DnaA homologs. Alignment was generated by ClustalX (Thompson et al., 1997).
(C) Stereo view of DnaCAAA+. Walker-A and -B motifs are blue and yellow, respectively. The sensor-I residue is green and the Box VII helix cyan. ADP and the coordinating magnesium ion (black) are shown within the ATP binding cleft. An internal disordered region is shown as a dotted line. This and all other molecular figures were generated with PyMOL (pymol.sourceforge.net).

