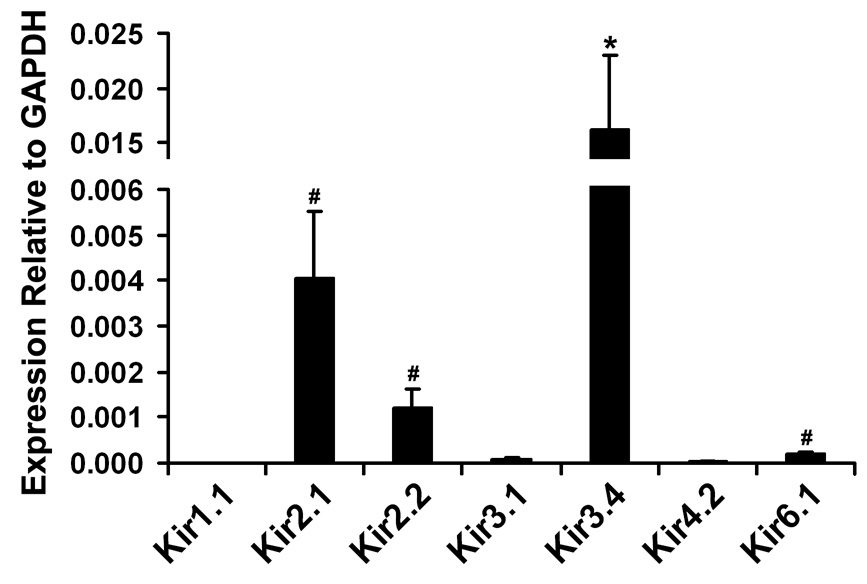
Figure 2. Relative expression level of Kir channel subunits in native human RPE.
The relative quantity of each specific Kir mRNA in the RPE was calculated using the relative standard curve method in which GAPDH served as the endogenous control (see Methods for details). Data summarize the relative expression levels of seven Kir subunits prepared from the RPE isolated from 4 to 6 individual donors. The relative expression of Kir1.1 (7.26 × 10⁻⁶ ± 2.66 × 10⁻⁶) is too low to be displayed. Each bar in the graph shows mean ± standard error for n = 4 (Kir3.1), n = 5 (Kir1.1, Kir2.1, Kir2.2 or Kir3.4), or n = 6 (Kir4.2 or Kir6.1) individual donors. *P < 0.05, compared to Kir1.1, Kir3.1, Kir4.2 or Kir6.1; #P < 0.05, compared to Kir1.1, Kir3.1 or Kir4.2.

