Figure 1.
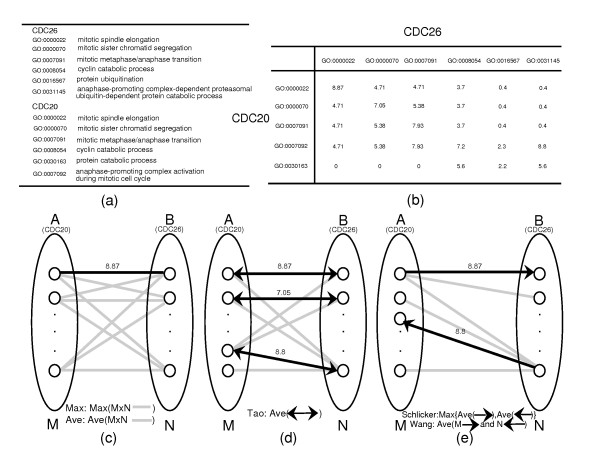
Graphical illustration of functional similarity measures. A summary of the current functional similarity approaches is provided in parallel to give an overview. (a) GO annotations of CDC20 and CDC26 in BP ontology. (b) Semantic similarity scores (from the Resnik method) between CDC20 and CDC26 annotations. CDC20 and CDC26 annotated with M (5) and N (6) GO terms (represented by small circles in c, d and e) form two groups A and B. The straight lines represent the semantic similarity scores between any two GO terms in groups A and B. A total number of 30 (5*6) scores are generated between CDC20 and CDC26. (c) The functional similarities are defined as the maximum values and average values over the 30 semantic scores for the Max and Ave methods respectively. The functional similarity score of CDC20 and CDC26 for Max is 8.87 (score between GO:0000022 and GO:0000022, straight black line), while for Ave, the value is 3.89. (d) The bidirectional arrows indicate the reciprocal best-score relations among GO terms. For example, GO:0031145 has the best score (8.8) from GO:0007092 among the other terms and vice versa, and the score is accepted. The best term for GO:0016567 is GO:0007092, while the best one for GO:0007092 is GO:0031145. The scores between these terms will not be counted. Tao took an average of all the accepted scores. The result from the Tao method is 4.5. (e) The maximum semantic score (best hit) is determined from each term in Group A to the terms in Group B (the forward arrows), and the process is repeated vice versa for the backward arrows. M (5 for CDC20) best hits from A to B and N (6 for CDC26) from B to A are collected. Schlicker defined the similarity of two genes as the maximum value of forward and backward average scores. By further combining the information from the MF and CC ontologies and normalizing the result into the range [0, 1], the Schlicker functional similarity score of CDC20 and CDC26 is determined to be 0.47. Wang defined the functional similarity between A and B as the average of M plus N (11 in the case of CDC20 and CDC26, 5 from each term of CDC20 to CDC26 plus 6 from each term of CDC26 to CDC20) directional best hits. The score is 7.3.

