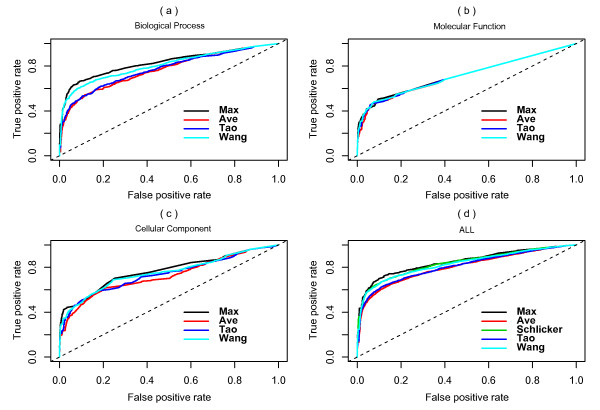
Figure 2.
ROC curves of PPI evaluations. ROC evaluations of functional similarity measures based on the S. cerevisiae PPI dataset derived from DIP are shown. The evaluation was done in (a) biological process (BP), (b) molecular function (MF), (c) cellular component (CC), and (d) ALL (root ontology). Since the Schlicker method requires all three ontologies, it is only suitable in ALL.

