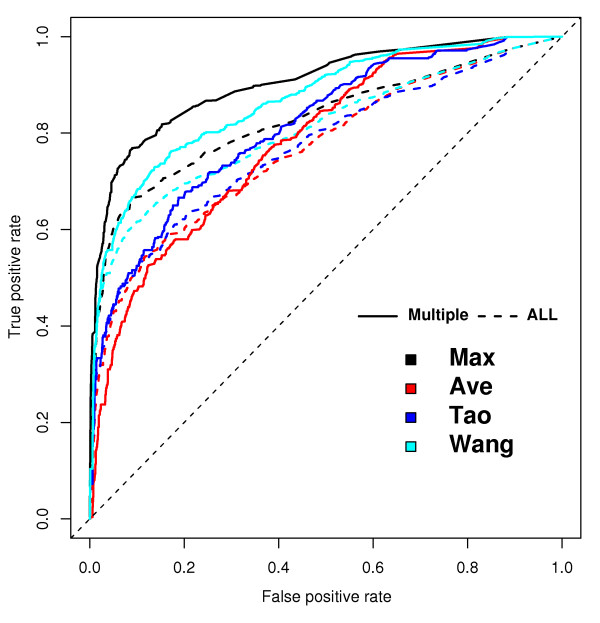
Figure 3.
Improvement of ROC curves after elimination of single annotations from the test dataset in the BP ontology. The four methods (Max, Ave, Wang and Tao) are plotted in separate colours. The performances of the methods after eliminating single annotations are shown by the solid lines. Results based on the original dataset are shown by the dashed lines. The Schlicker method was not shown because it requires more ontology than BP.

