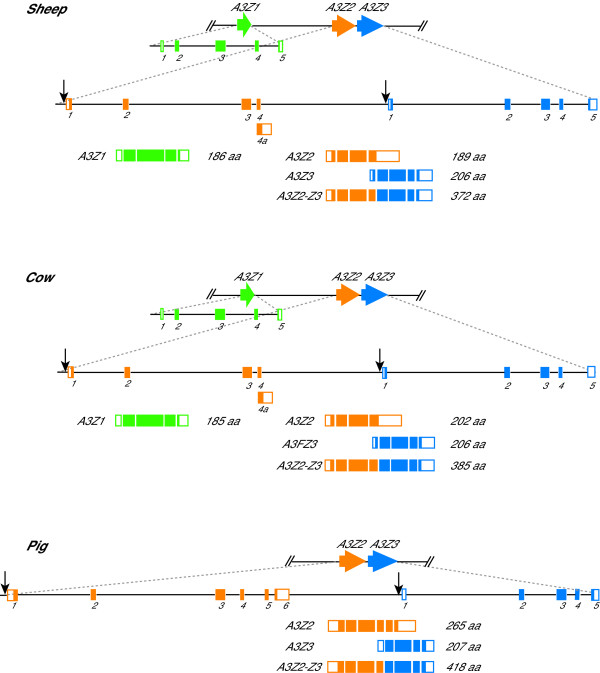
Figure 3.
The coding potential of the sheep, cow and pig A3 genes. Z1, Z2 and Z3 domains are colored green, orange and blue, respectively. The exons are shown below the gene schematics with coding regions represented by filled boxes and untranslated regions by open boxes. The gene schematics and exon blow-ups are drawn to scale. Arrows indicate approximate positions of predicted ISREs (Additional File 4). See the main text and the Methods for details.

