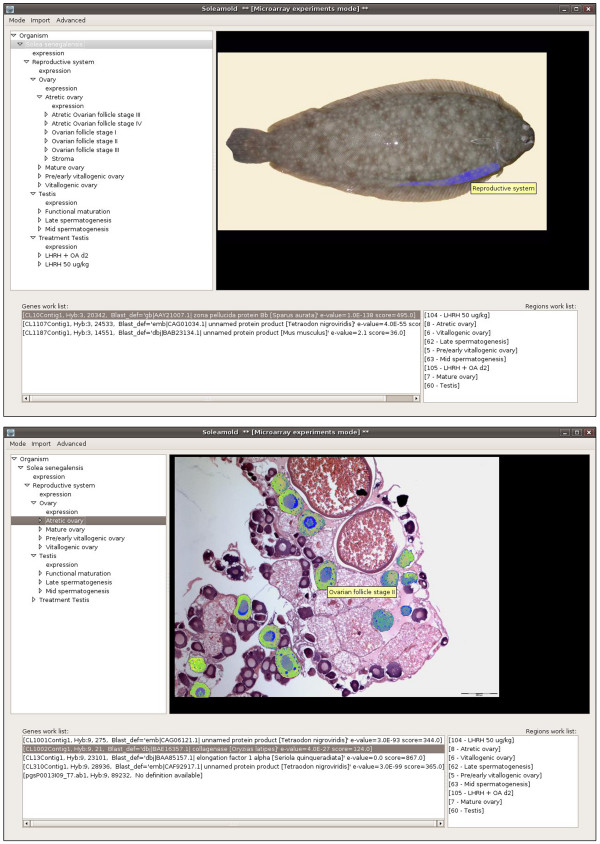
Figure 4.
Soleamold main interface and navigation of the atlas. The upper panel shows the Soleamold main interface which is divided into three interrelated sections: a hierarchical tree with the ontology describing the organism (upper left), an atlas coherent with the terms of the ontology (upper right), and two work lists for the regions (i.e., samples) and genes of interest. All parts of the interface are interactive and/or navigable through contextual menus and have been designed to be visually intuitive, allowing for constant contextualization of the data. The lower panel shows that the construction of an atlas coherent with the ontology allows for the construction of maps that, when overlaid with the original picture, highlight the different regions that can be identified in the picture. Thus, users can slide the cursor over any image and rapidly identify and/or select each region in it. In the figure, follicles at stage II from an atretic ovary are highlighted.

