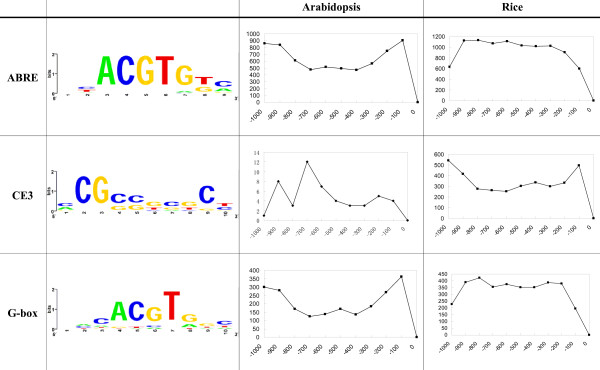
Figure 8.
Sequence logos and distribution of ABREs, CE3s and G-boxes on the upstream of peptide-coding genes in Arabidopsis and rice. The first column shows the names of each cis-regulatory element (CRE). The second column for each motif shows the nucleotide frequency distribution graphed using WebLogo, where the sizes of the characters represent the frequencies of occurrence. The third column provides a graphic representation of the frequency distribution (y-axis) of each motif in the [-1000, -1] regions (x-axis).

