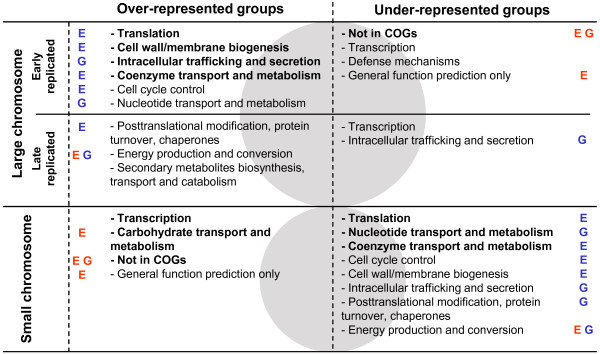
Figure 5.
Distribution of COGs within three different parts of the Vibrio genome. Relative over- and under-representation of COGs within the origin-proximate (upper panel) and terminus-proximate (middle panel) parts of the large chromosome and within the small chromosome (lower panel) are shown. Categories listed show agreeing distributions within each of five Vibrio species (see Table 1) and categories in bold display distributions that are significantly different from an average in each separate species (P < 0.05, see Additional file 4). Blue tags represent an over-representation of essential (E) or most growth contributing (G) genes within the category while red tags represent an under-representation (see Additional file 5).

