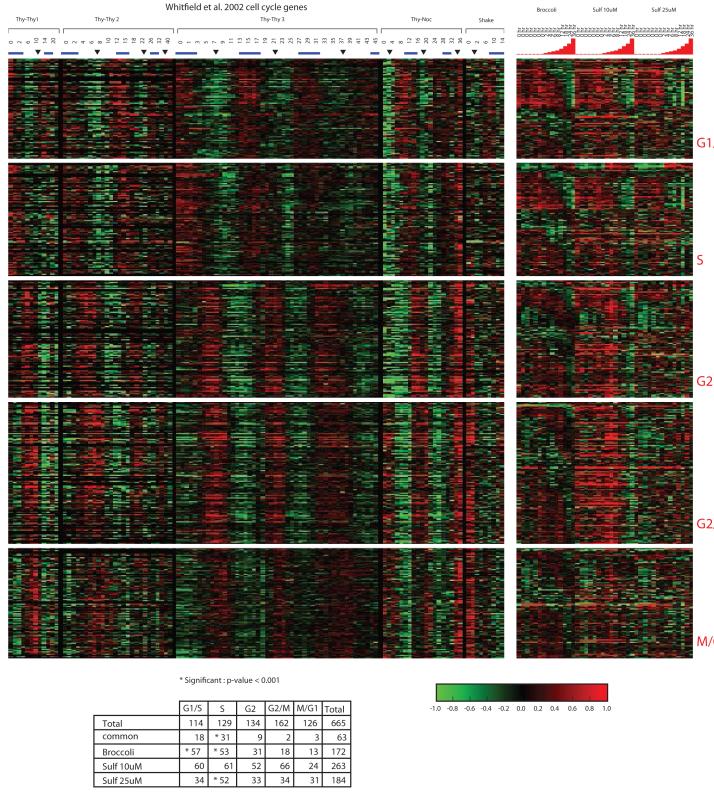
Figure 3.
Comparison of genes modulated as cells pass through the cell cycle from Whitfield et al to the transcript profiles significantly altered by broccoli sprouts, sulforaphane 10 μM and sulforaphane 25 μM. Over the time course, the majority of transcripts associated with G1/S and S phases show declining expression, while many associated with G2 and G2/M show increasing expression. Hypergeometric test confirms enrichment of transcripts in G1/S and S, with corresponding decreased gene expression levels.

