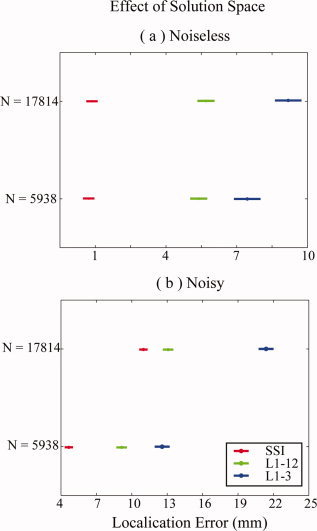
Figure 4.

Effects of the size of solution space. (a) Noiseless case; plots are produced by post hoc test (Duncan at 0.01) in a two‐way ANOVA analysis. (b) Noisy case; plots are produced by post hoc test (Duncan at 0.01) in a three‐way ANOVA analysis. [Color figure can be viewed in the online issue, which is available at www.interscience.wiley.com.]
