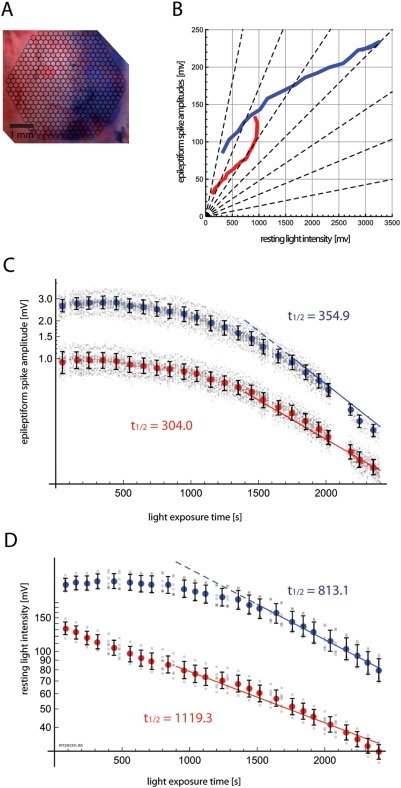
Figure 3. Staining quality affects ΔF and FRLI differently.
A. Dura in the left half of the field was protected with a small piece of tissue paper during dura permeabilization and staining. Blue and red highlights indicate the selected areas for which signal was plotted in subsequent panels. B. Epileptiform spike amplitudes (ΔFepileptiform) and resting light intensity (FRLI) were measured over time, as in Figure 2, and plotted against each other. ΔFepileptiform/FRLI is nonlinear over the experiment. Furthermore, well-stained areas (blue) show different patterns of ΔFepileptiform/FRLI change compared to poorly-stained areas (red). C. The timecourse of epileptiform spike amplitude (ΔFepileptiform) is plotted as in Figure 2B. Signal from poorly-stained areas (red) were smaller overall in amplitude, and showed somewhat faster “bleaching” kinetics within the exponential phase. D. Timecourse of resting light intensity (FRLI) is displayed as in Figure 2C. FRLI was smaller overall in the poorly-stained half. The exponential time constant of the poorly-stained area is much slower, and a large qualitative difference in bleaching kinetics is also evident. These results demonstrate that the staining quality can affect the relationship between ΔF and FRLI, introducing hard-to-control biases when using the standard ΔF/FRLI normalization.

