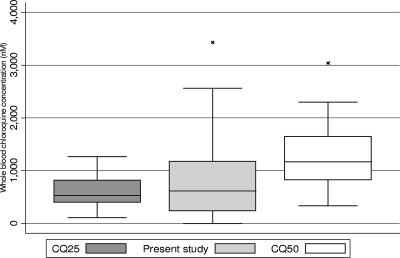
FIG. 2.
CQ concentrations in whole blood measured in this study compared with those found after observed intake of 25 or 50 mg kg−1. Three outliers are not shown (CQ25, 5,490 nM; CQ at day 4, 5,440 nM; CQ50, 4,780 nM). The line in each box represents the median CQ concentration. The box represents the interquartile range, and the range spike represents the 5th to 95th percentiles. CQ25 and CQ50 are the CQ concentrations determined 4 days after observed intake of 25 mg kg−1 and 50 mg kg−1 split into one and two daily doses, respectively, over 3 days. CQ concentrations shown for the present study were measured 4 days after the last reported dose. For the median and interquartile-range values, see the legend to Fig. 1.

