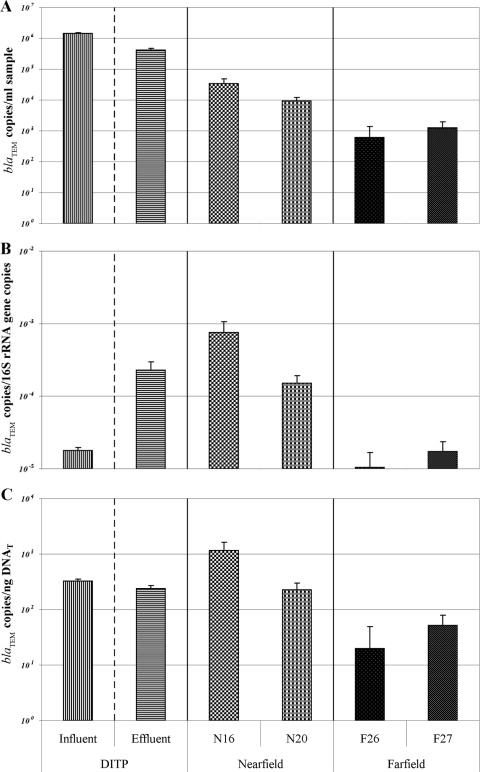
FIG. 3.
blaTEM copy number per ml of sample (A), relative to bacterial count (as estimated by 16S rRNA copy number) (B), and relative to biomass (as estimated by total DNA concentration) (C). Gene copy numbers were determined by quantitative PCR. Bars represent means. Error bars represent standard errors.

