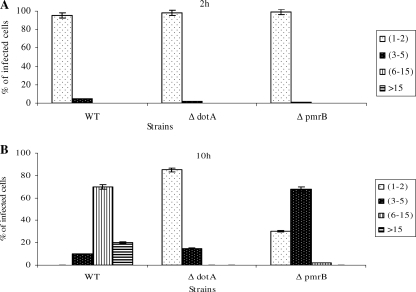
FIG. 4.
Single cell analyses of replicative phagosomes. At 2 and 10 h postinfection of hMDMs, 100 infected cells were analyzed by CLSM for the formation of replicative phagosomes. Representative quantitation of the number of bacteria/cell at 2 h (A) and 10 h (B) is shown. The dotA mutant was used as a negative control. Infected cells from multiple coverslips were examined in each experiment. The results are representative of three independent experiments performed in triplicates. Error bars represent the standard deviations.

