FIG. 1.
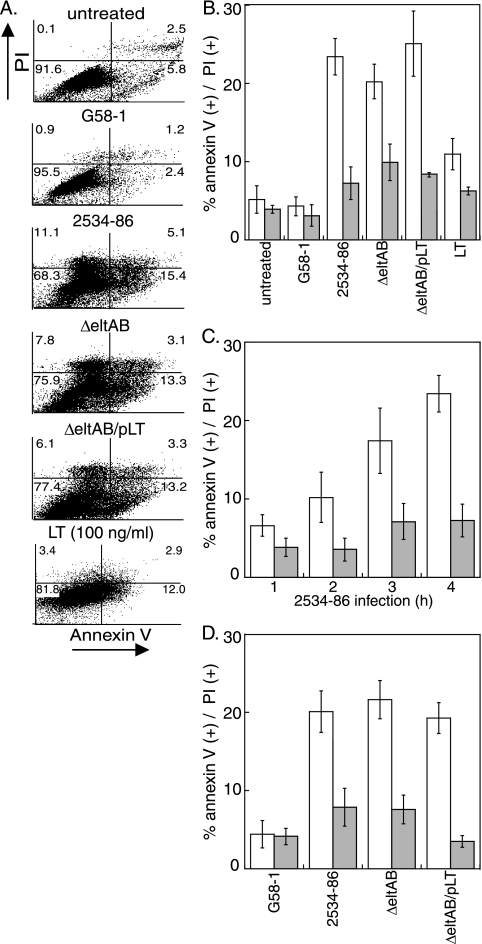
ETEC induces PS exposure in IPEC-J2 cells. (A) Flow cytometry analysis of PI (y axis) versus annexin V (x axis) staining of IPEC-J2 cells following infection (4 h) with the bacterial strains G58-1, wt 2534-86, 2534-86 ΔeltAB, and 2534-86 ΔeltAB/pLT or intoxication with 100 ng/ml LT. (B) Quantification (% positive cells) (means ± SD; n = 4) of annexin V (open bars) and PI (shaded bars) staining from flow cytometry experiments. (C) Quantification (means ± SD; n = 4) of annexin V (open bars) and PI (shaded bars) staining as a function of time (1 to 4 h) following inoculation of IPEC-J2 cells with wt 2534-86. (D) Quantification (means ± SD; n = 4) of annexin V (open bars) and PI (shaded bars) staining following intoxication of IPEC-J2 cells (4 h) with OMVs (100 ng/ml) purified from the indicated bacterial strains.

