FIG. 2.
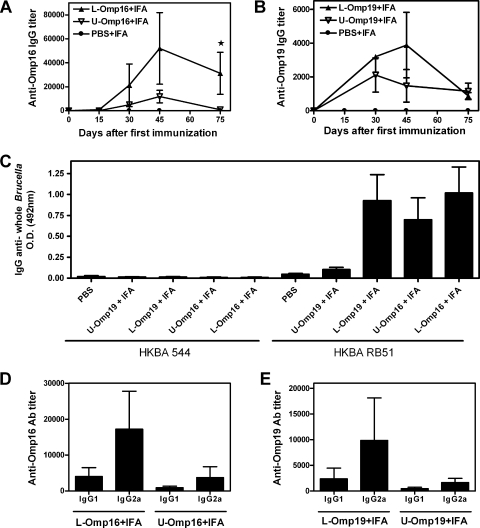
Comparison of specific humoral immune responses induced after immunization with L-Omp16, U-Omp16, L-Omp19, or U-Omp19. Mice were immunized with 10 μg of lipidated (▴) or unlipidated (▿) Omp16 or Omp19 in IFA i.p. at days 0 and 15 and bled retro-orbitally at the indicated days after the first immunization. Anti-Omp16 (A) or anti-Omp19 (B) IgG titers were evaluated by ELISA. Each point represents the mean Ab titer from 5 mice in each group ± standard error of the mean. Star, significantly different from U-Omp-immunized group (P < 0.05). IgG Abs against HKBA 544 (smooth strain) or HKBA RB51 (rough strain) were determined at the day of challenge (C). Each bar represents the mean absorbance (optical density at [OD] at 492 nm) measured from 5 mice in each group ± standard error of the mean. IgG1 and IgG2a isotype profiles of mice inoculated with 10 μg of Omp16 (D) or Omp19 (E). Specific isotype titers were evaluated by ELISA. Data are representative of two separate experiments. Each bar represents the mean Ab titer ± standard error of the mean of five animals.

