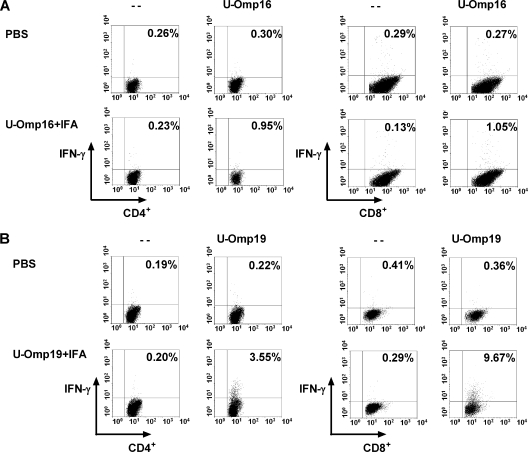
FIG. 4.
Flow cytometric analysis of intracellular IFN-γ production by CD4+ or CD8+ T cells. Spleen cells from mice immunized with PBS or with U-Omp16 or U-Omp19 protein plus IFA were cultured with mitomycin C-treated A20J-Omp16 or mitomycin C-treated A20J-Omp19 cells (stimulator cells) for 5 days. Then cells were restimulated for 6 h with U-Omp16 (10 μg/ml) and stimulator cells or with U-Omp19 (10 μg/ml) and stimulator cells or complete medium alone (−). Brefeldin A was added for the last 4 h, and then cells were stained for CD4+ and CD8+. Cells were then fixed, permeabilized, and stained for intracellular IFN-γ. Numbers in the upper quadrant represent the percentage of CD4+ or CD8+ T cells positive for IFN-γ.

