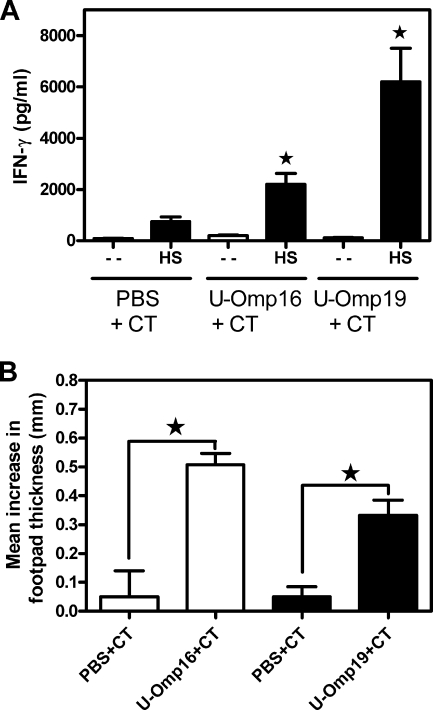
FIG. 6.
(A) IFN-γ production in spleen cells from mice immunized orally with PBS, U-Omp16, or U-Omp19 plus CT. Spleen cells were cultured at 4 × 10⁶ cells/ml with HS extract (20 μg/ml) or complete medium alone (−) for 72 h. Each sample was assayed in duplicate wells. IFN-γ in these culture supernatants was measured by sandwich ELISA. Data represent the mean ± standard error of the mean from each group of five mice. Data are representative of two separate experiments. Star, significantly different from the same stimulus in PBS-immunized mice (P < 0.05). (B) Induction of the DTH response after intragastric immunizations with U-Omp16, U-Omp19, or PBS with CT. Bars represent the mean increase in footpad thickness (mm) ± standard error of the mean at 72 h after the injection of U-Omp16 or U-Omp19 into the left footpad and PBS into the right footpad. Star, significantly different from mice immunized with PBS plus CT injected with the same Ag (U-Omp16 or U-Omp19) (P < 0.01).

